Final Project
Environmental Documentary Project
Project Description: For this project we had to make a documentary about an environmental issue. We had to find interviews and get footage that we either made or got from someone else. We took the skills we learned about light and rule of thirds to make our interviews and footage pop out and look professional. Once we got all of our footage we started putting together and editing it. Our group took a lot of time on editing and change things often. Once we were done with editing and putting all the footage together our documentary was finished.
To see my documentary click the botton above
Rube Goldberg Project
Project Descriptions
I remember going to my older brothers Rube Goldberg and I was super amazed of what people created. I couldn't wait to make a Rube Goldberg when I got in High School and I got to. For our second project, we researched a guy named Rube Goldberg. He first started out making cartoon strips and then moved into making a machine that accomplished a simple task in many challenging steps. We then took those examples and what concepts we learned in Physics to start our Rube. The concepts we learned were force, Potential Energy, Kinetic Energy, efficiency,etc. Once we knew some background information we started to build our rube. Our Rube Goldberg in the end made coffee. Other rubes made toast, tea, salad, or make waffles.
- We started our design for our Rube Goldberg with a brainstorm. After watching some video inspiration, we came up with ideas of what our end goal would be. When we had decided our end goal, we brainstormed and sketched out each step.
- One of the concepts that applies to our contraption the most is momentum. Most of the issues we ran into with our project were in terms of momentum, either having too much, or too little. Therefore, because of these issues, and some labs that we completed, we have a good understanding of momentum. It applies to our rube in controlling how fast marbles and dominoes need to go, in order to get our rube to work.
- We learned lots of construction skills. At first, the rube was very unstable, but the more work we did, we began to understand building concepts. We learned about supports and how to make objects more sturdy. We also all learned to drill at advanced levels as well as to cut using the electric saw.
First Project (Info-graphic)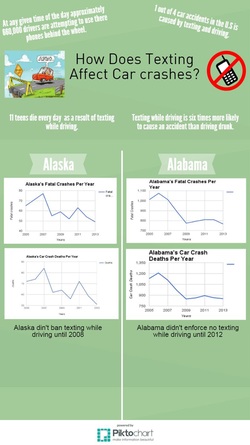
|
Explanation:
Essential Question: How does technology affect us; our well being, safety, health, ability to learn and development?We made a question that we could test in some way. Trudy's and my question was: How many car crashes happened before and after testing was banned while driving in Alabama and Alaska? Once you know your question you could either make your own experiment and collect your data that way or you could research websites that have already done experiments and collected data and just use what they have collected on that subject. We decided to just research what data others had collected and then put our data into a info-graphic to show to others. It allowed us to work on our research skills, data collecting skills, and graphing.
Reflection:
In this project, I feel like I did really well with time management and planning out what I was going to do each day. The project log really helped me just to see what I've already done and what I still needed to do. My partner and I collaborated really well and both finished the work that we needed to do on time. Before this project I had troubles knowing what type of graph I should use for the data I collected, now I know when and what graph I should use to show data. I really liked researching our data and instead of making our own experiment because it made me more aware of the whole United States instead of just Animas High School.
